

Now more than ever, having access to accurate, real-time reporting on key metrics and key performance indicators (KPIs) could be the difference between staying ahead or falling behind the competition.
Learning how to leverage a tool like Microsoft’s Power BI can help you gain greater visibility, and partnering with knowledgeable experts can help you maximize the value of your raw data.
What is Power BI and How is it Useful for Business Intelligence?
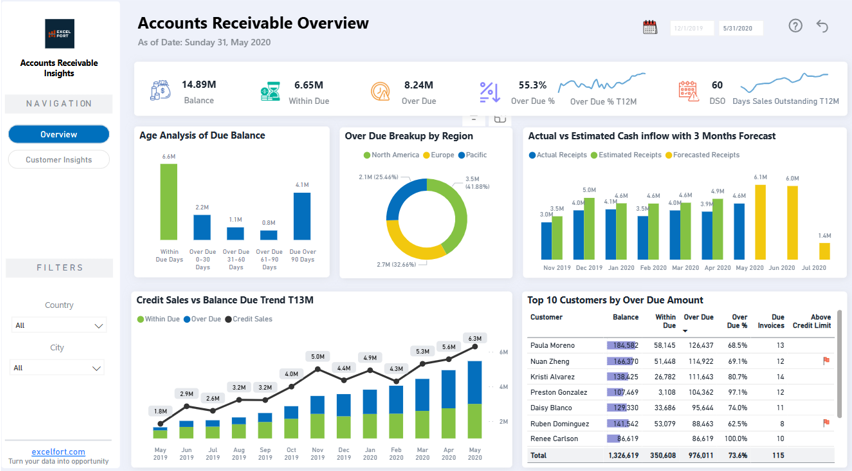
Figure 1: An example of an interactive Accounts Receivable dashboard, created from a company’s QuickBooks data.
Power BI is a collection of software services, apps, and connectors that work together to turn your unrelated sources of data into coherent, visually immersive, and interactive dashboards. Your data might be an Excel spreadsheet, or a collection of cloud-based and on-premises hybrid data warehouses (click here for a list of supported data sources). By centralizing data from different systems, Power BI allows businesses to identify important trends, reduce inefficiencies, and drive strategic growth.
Our Top 5 Use-Cases, Regardless of Industry:
- Executive Dashboards
- Monitor company-wide performance with a high-level overview of revenue, expenses, and operational efficiency. This view allows owners and shareholders to view the status of the business and make informed decisions without investing excessive time
- Customize reports to track goals, identify trends, and flag areas requiring attention
- Sales & Revenue Tracking
- Connect Power BI to your CRM (e.g. Salesforce Reports) and current sales targets to analyze sales trends, lead conversions, and revenue growth. Compare year-to-date sales with prior-year to date, month over month, etc.
- Identify high-performing sales areas (reps, divisions, locations etc) and optimize sales strategies with real-time insights
- Financial Reporting
- Simplify financial reporting by importing data from accounting systems like QuickBooks Online, NetSuite, or SAP
- Track revenue, costs, and expenses while comparing year-to-date figures with prior year-to-date data, analyze month-over-month trends, and evaluate current performance against previous years
- Operational Efficiency Metrics
- Analyze your team’s worked hours by importing time entry data, monitor production cycle trends (ex. identify “busy times”) to optimize resource allocation and potential bottlenecks
- Customer Insights & Retention
- Track customer churn rates, new customer growth year-over-year, and customer lifetime value (CLV) to examine and refine retention strategies
How Experts Can Help:
While Power BI is designed for user-friendly data visualization, creating optimized reports and dashboards requires expertise. Here’s how our team can help:
- Custom Dashboard Creation: We design Power BI dashboards tailored to your unique business requirements and walk you through the process of what data you need to bring your vision to life
- Data Integration & Import: Our experts connect Power BI to all your critical data sources, ensuring a seamless workflow
- Advanced Analysis Help: Our team of analysts are experienced in asking the right questions and can help you decide which metrics and trends should be analyzed to provide meaningful insights
- Ongoing Support: Our team is available to help from initial setup and troubleshooting to continuous optimization to ensure your dashboards are as impactful and accurate as possible
Contact us today to discuss your Power BI needs or book a free discovery call consultation to see how business intelligence can transform your operations. To learn more on how our team can help you leverage Power BI, click here.
References: